In the first part of this blog post series, we went over some use cases for using NLP for Security and Compliance. You can refer back to the first blog post to see the full list of use cases. For this second part we will cover Use Case H which is related to software supply chain management, a hot topic at the moment.
📝 For a brief introduction to software supply chain security. There is also a good overview with some deeper dives into supply chain attacks.
Use case H: Company B generates Software Bill of Materials on every release of both binaries and container images of all its microservices, which occur at least daily. It also generates SBOM of any major piece of software it runs e.g. ELT Tool, Dependency Track for every release we use. They want to know when or if a CVE appears in the output. They don’t want to have to search through daily or wait for a breach to happen to know they were affected.
I won’t be focusing much on the different standards, frameworks or tools in the current supply chain ecosystem. My focus will instead be on the internal work we have done at Kapiche related to this topic and some of the interesting things we have discovered along our journey so far. We are starting to see a lot of movement in supply chain security on the vendor side e.g. I think I’ve updated and redone this blog four or five times cos of the additions to the pipeline just this year. What we hope to do via this blog and others sharing their implementation stories is share how companies are using tools and implementing supply chain security, so we can learn and build together.
What I will go through below is our pipeline for dealing with the thousands of CVEs and finding what we actually need to fix, dealing with Software Bill of Materials (SBOM), Vulnerability Exploitability eXchange (VEX) and Vulnerability Disclosure Reports. We will go over what metadata we can go and where from, why we need and for what purpose and how it can make our lives easier in identifying what to fix and when.
Too often SBOMs are being overused as the final goal. Instead like most things in security SBOMs should be treated as a data point, like VEX, EPSS and CVESs to get to our end goal or at least help us answer questions like:
- Are we secure?
- Are we affected by the CVEs the scanners are saying are critical?
- What are the false positives or false negatives?
- What is my risk?
One of the issues we ran into was that we had this ever-increasing sprawl of microservices, and with it came lots of SBOMs generated with Trivy. We could have published this for vendors, but SBOM data has many false positives and VEX reports can be cumbersome to maintain. So what else can we do with this data, and how can we automatically maintain our VEX data?
We publish this SBOM data to BigQuery, in keeping with our general data strategy, as a way to build a better picture of our entire landscape. We thought about what other metadata we need besides SBOM data and recently added SBOM scorecard metadata, this was mainly due to this amazing piece of analysis done by the Chainguard team. This was also to allow us to create policies in code in BigQuery around which SBOM data is considered valid based on certain standards e.g. Software Component Verification Standards BOM Maturity Model and our own internal policies as they evolve.
We then wanted to add vulnerability information. So initially we were sending this from Trivy, but now we get this from GKE container metadata using some interesting work Mark Chmarny has done around automating supply chain security.
We also wanted to pull in Exploit Prediction Scoring System (EPSS) data to be able to better score risk and likelihood. The Exploit Prediction Scoring System (EPSS) is an open source model provided by the non-profit Forum of Incident Response and Security Teams (FIRST). At a high level, the score refers to the probability (0-1 scale) that a Common Vulnerability and Exposure (CVE) will be exploited by a malicious actor in the next 30 days. Please see https://www.first.org/epss/model for additional details on how to interpret the results. See this article for a high-level analysis: Deep Dive into EPSS and Deploy Securely Risk Assessment Model on how to ingest EPSS and for help calculating the loss from the exploitation of a given vulnerability, using the confidentiality, integrity, and availability (CIA) triad. We have now enriched our vulnerability information with likelihood and severity information. Later we will further add our own context / likelihood categories / tags much like EPSS does based on our applications instead of the vulnerabilities so we can then match them up.
All the different types of data that are sent to BigQuery get put into partitioned tables and in different datasets. Then we have a daily scheduled query to join all our BigQuery datasets and put the results in a new dataset. Next we use the SBOM scoring and codified policies to make sure we have valid SBOMs, then we pull in the vulnerability data and join it on the application or container image name (generally these are the same). After that we use data from EPSS to add a risk level. We add some other risk metadata around concerns such as whether a component is internal or external, whether components are signed or unsigned, whether we know the component’s provenance.
📝 I must point out that we have a general strategy / policy that can’t always be adhered to, that is to use a new container image in one of our clusters, it needs to be signed and have provenance attached to it, as we have setup our Gatekeeper Open Policy Agent to only let container images run if they are from a known list and signed. Allowing only signed images requires extra setup, to call external data as shown here or use another policy controller from sigstore. We use a lot of the other examples as well from the Gatekeeper policy library, but those are the main two of interest for this topic. For this we often have to set up internal pipelines to sign these containers ourselves or get vendors to support this.
So once it has all been Ingested in BigQuery, we can then “Analyze” it in Kapiche. Now first we have metadata about the CVEs that scanners think are affecting our applications we are running and we have the title and description information for these. This is where I guess having an NLP engine comes in handy. I can look at the top 20 concepts and construct what we call themes for each. We first build out basic themes that match the EPSS data, as we will use that as part of our risk matrix. Then we will use what’s called the “Unmapped Verbatim’’ section to see if there is anything we are missing. Once we have our themes all worked out, we set up to ingest from BigQuery nightly so it will pick up any new data and see if anything new matches. We then set up an export job to push back into BigQuery what we have found. We then have a google sheet datasource in BigQuery which is just a map of each of our applications and the categories/tags that apply to them. We then use the daily export from Kapiche and the application map to join against the categories and we then have a new automated way of getting to what we actually think we are vulnerable to. We then expose this data for internal consumption through a nice BI dashboard and to publish our final VEX report with vexctl. We can also see very early whether we need to put out a VDR. We then add a task to our weekly security check-in to go to our Kapiche analysis and check the “Unmapped Verbatims section, which tells us any new words that have not been included in any themes, so any words from titles or descriptions of vulnerabilities which are probably new vulnerabilities that have been picked up, that we have not mapped to Themes or Categories. We will also check the “Emerging Concepts’’ section of the product, this is helpful, as it will show us segments that are emerging and have high frequencies within a certain time period. So we can see CVEs with high EPSS segment data that have tags like user interactions and network.
An added benefit of having this continual data going into Kapiche, is we can jump in and answer any high level questions on numbers and segments across all our microservices. Kapiche is very good at slicing and dicing the data, so we can generally answer any adhoc question of the data.
Here is one of our microservices Continous Integration, Continuous Deployment and Continous Attestation flows 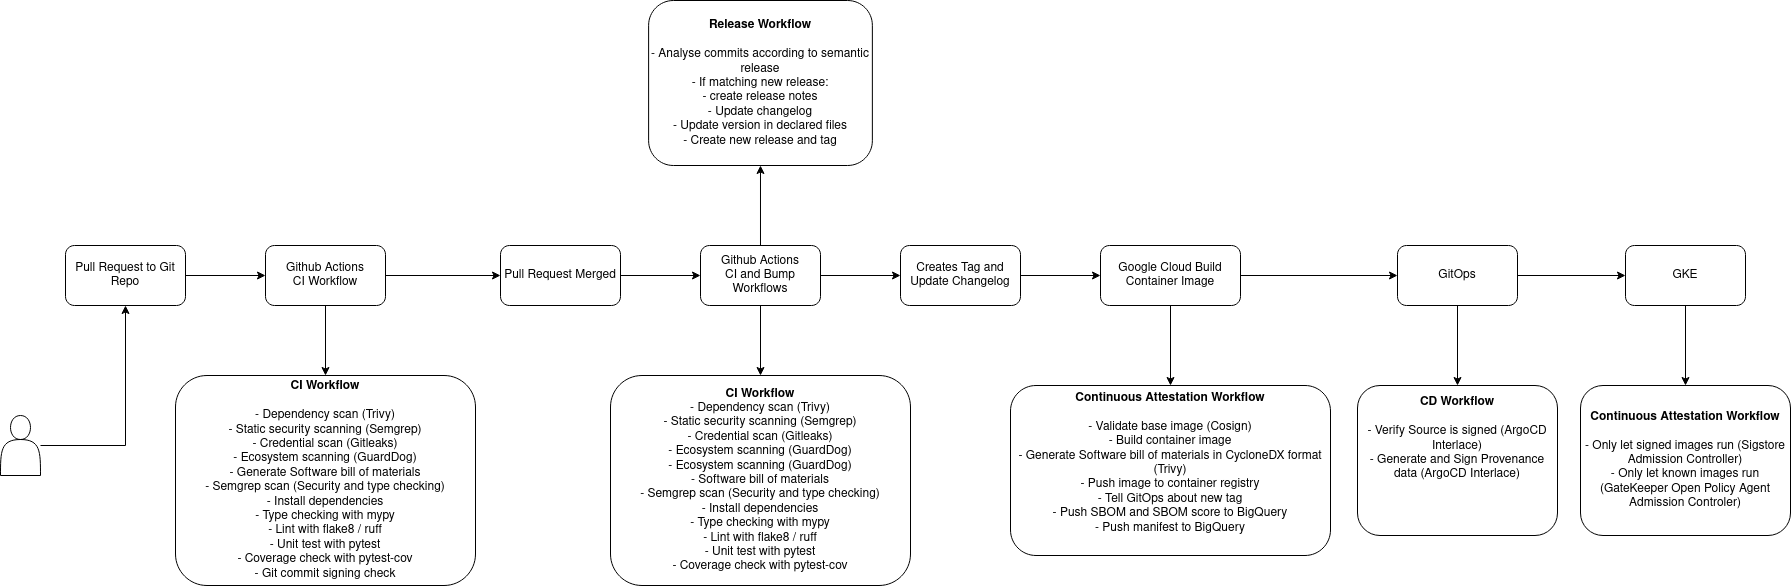
Here is our DevSecOps ToolChain 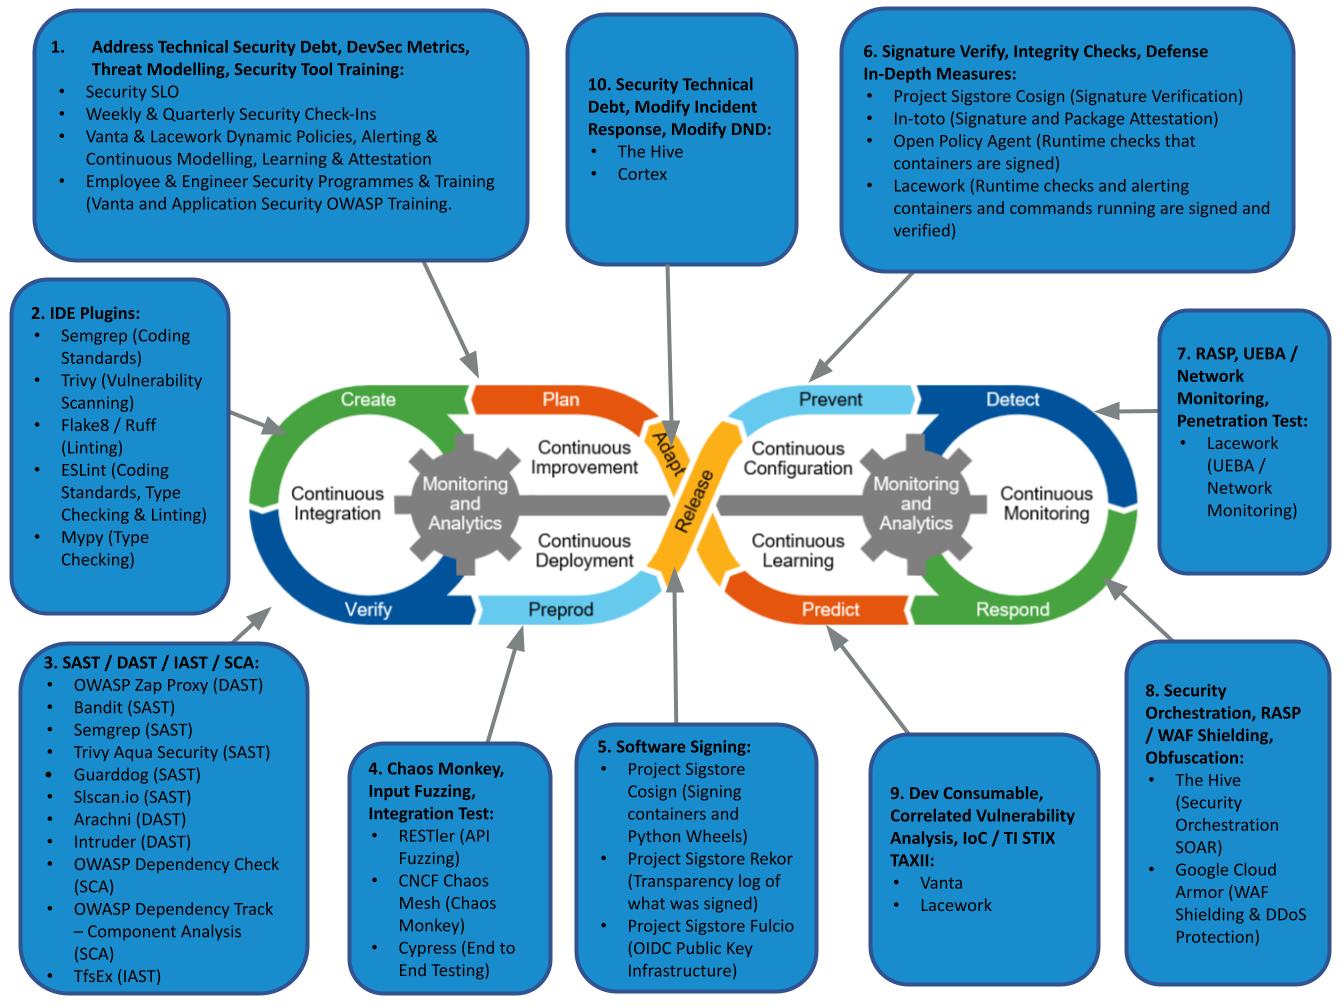
Future Work
Greater Context
We are also looking for ways to add more metadata or context to this story. We use Dependency Track, which we also upload our SBOM data to, this has more vulnerability datasources, so can often give more context. It’s also a lot easier if we are given an SBOM from a vendor to upload and assess it, not that we are at that stage yet. We also have our policies in there around licenses and vulnerabilities much like we have in BigQuery. It tends to do a better job of component analysis or per service analysis, so we see a much more fine grained view. I have to find time to figure out how to export the information I want into the right format in BigQuery. This should give greater context to our analysis, then we can Share our results. I also want to share more of scripts we have done, even though most of what we have used is opensource, the key bits are the joining bits.
Machine Learning
We are looking to apply more software engineering and supply chain management principles to our Machine Learning (ML) images and workflows. We currently build container images from the ML models we use. This means we download from HuggingFace or our ML Model Registry at build time instead of downloading at runtime. Three benefits we get from this: we are signing and being very declarative on what ML model and version we are using; and this metadata gets included in our pipeline for analysis; and the third one is faster start up times for our ML services, as sometimes these models can get up to 8 GB in size. We also get the added bonuses of adding signing and provenance to our ML models, which is lacking severely and is a huge hole in the industry at the moment: most models people use are either in cloud buckets or on Huggingface. Machine learning models should be built like other artifacts and using principles that are developing in the software supply chain like signing, provenance, attestation. The models should be then stored in artifact stores. Another big area we are focusing on is ML image size: currently these can range from 2 GB to 5 GB, due to model size and tool bloat. For example, Nvidia drivers, pytorch, and then ML models on top. This can often mean many extra vulnerabilities to manage. One could use a cloud service to run models, but the problem still exists. I ran one of our models on Vertex AI and the image used came back with 271 vulnerabilities (11 High, 174 Medium) and it was still 2.7 GB. You need to make sure you are checking with your service providers what your Shared Responsibility Model is.
Integration
We are experimenting with a few Chainguard images for Python, Rust and tools like curl, kubectl etc. Expanding these out to be used in more services, especially Machine Learning images which I feel are very bloated.
We are also experimenting with OX Security for their Pipeline Bill of Materials. This is more experimenting at this stage, to see what they pickup and more value add they can add to our current flow. The other big thing we are excited about at the moment is Open Software Supply Chain Attack Reference (OSC&R) which is definitely worth the read. It’s basically the software supply chain equivalent of MITTRE ATT&CK.
ACKNOWLEDGEMENTS
Huge thanks to Walter Haydock for his analysis, blogging and forward thinking with EPSS. The Chainguard team for their analysis and pushing forward of this space and everyone else working either in or around supply chain security at the moment. It feels like there is a lot of good momentum.